What is Web Analytics and Why You Need It
Discover the power of web analytics. Learn how tracking visitor behavior, understanding user journeys, and measuring key metrics can transform your business decisions.
What is Web Analytics and Why You Need It
Web analytics is the measurement and analysis of visitor interactions with your website or application. It's the bridge between your digital presence and business insights—transforming raw data into actionable intelligence that drives growth.
Understanding Web Analytics
At its core, web analytics answers fundamental questions about your online presence:
- Who is visiting your website?
- What are they doing while they're there?
- Where are they coming from?
- When do they visit?
- Why do they leave without converting?
These answers form the foundation of data-driven decision-making.
Why Web Analytics Matters
1. Understand Your Audience
Web analytics reveals demographics, geographic locations, devices, and browsers your visitors use. This insight allows you to optimize your website for the devices and experiences your audience actually uses.
2. Track User Behavior
See exactly how visitors navigate your site:
- Which pages attract the most traffic
- How long users spend on each page
- Where users drop off in your conversion funnel
- Which features get the most interaction
3. Measure Business Goals
Whether you're running an e-commerce store, SaaS platform, or content site, analytics helps you measure:
- Revenue and sales metrics
- Sign-up and registration rates
- Content performance and engagement
- Customer lifetime value
4. Optimize Conversion Rates
Understanding where visitors abandon your funnel helps you fix bottlenecks. By testing changes and measuring their impact with analytics, you can incrementally improve conversion rates—directly affecting your bottom line.
5. Detect Problems Quickly
A sudden drop in traffic or spike in bounce rate is a warning sign. Analytics alerts help you identify and respond to issues before they significantly impact your business.
Key Metrics You Should Monitor
Traffic Metrics
- Page Views: Total number of pages viewed
- Unique Visitors: Individual users visiting your site
- Sessions: Discrete visit periods by users
- Bounce Rate: Percentage of visitors leaving after viewing one page
Engagement Metrics
- Average Session Duration: How long visitors stay
- Pages per Session: Average pages viewed per visit
- Scroll Depth: How far down the page visitors scroll
- Time on Page: Duration spent on specific pages
Conversion Metrics
- Conversion Rate: Percentage of visitors completing desired actions
- Goal Completions: Number of specific actions taken
- Revenue per Session: Average money generated per visit
- Customer Acquisition Cost: Cost to acquire one customer
Audience Metrics
- Device Distribution: Desktop vs mobile vs tablet traffic
- Browser Usage: Which browsers your users prefer
- Geographic Location: Countries, regions, cities of visitors
- Traffic Sources: Direct, organic search, referrals, paid ads
Types of Web Analytics
1. Quantitative Analytics
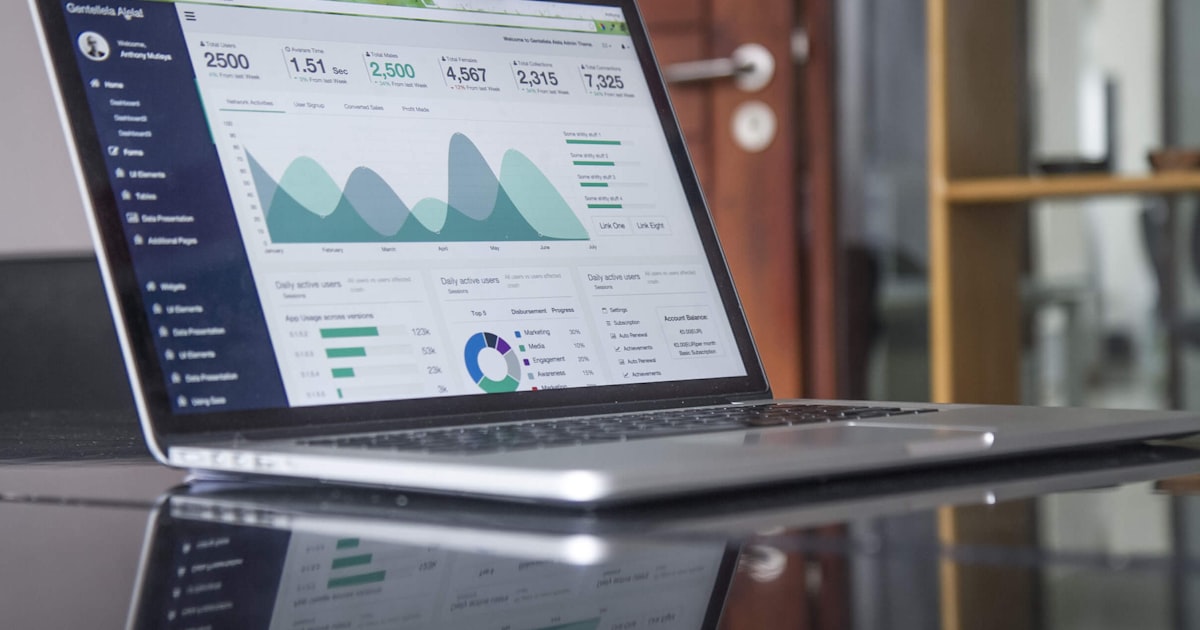
Numerical data about what happens on your site: page views, session duration, conversion rates. Tools provide dashboards filled with numbers and charts.
2. Qualitative Analytics
Understanding the "why" behind user behavior:
- Session Replays: Watch actual user sessions to see exactly how visitors interact
- Heatmaps: Visualize where users click, move, and scroll
- User Surveys: Directly ask visitors about their experience
- Feedback Forms: Collect opinions and pain points
3. Real-Time Analytics
Monitor visitor activity as it happens, allowing you to respond immediately to issues or capitalize on unexpected traffic spikes.
Common Web Analytics Challenges
Attribution
Understanding which marketing channel deserves credit for a conversion is complex. A user might see an ad, read a blog post, and then search before converting—which touched deserve credit?
Privacy Concerns
Increasing privacy regulations (GDPR, CCPA) and browser restrictions on tracking cookies are changing how analytics works. First-party data collection and consent-based tracking are becoming essential.
Data Overload
Raw analytics data can be overwhelming. The key is focusing on metrics that align with your business goals, not vanity metrics.
Sample Size
For new websites or low-traffic pages, statistical significance matters. Small sample sizes can lead to unreliable conclusions.
How to Get Started with Web Analytics
-
Define Your Goals: What do you want to measure? Conversions, engagement, content performance?
-
Choose Your Tools: Whether it's Google Analytics, Seentics, or another platform, select tools that match your needs.
-
Set Up Tracking: Install tracking code, configure goals, and ensure you're collecting the right data.
-
Create a Baseline: Establish current metrics before making changes so you can measure impact.
-
Make Changes: Test improvements to your site based on insights.
-
Measure Impact: Use analytics to quantify whether changes improved your metrics.
-
Iterate: Continuously refine based on data.
Why Seentics for Web Analytics
Seentics provides comprehensive web analytics with:
- Session Replays: See exactly how users interact with your site
- Heatmaps: Visualize click patterns and scroll behavior
- Real-Time Dashboard: Monitor your site as visitors use it
- Conversion Funnels: Identify where users drop off
- Detailed Segmentation: Analyze visitor behavior by cohort
Beyond raw metrics, Seentics helps you understand not just what users are doing, but why they're doing it.
Conclusion
Web analytics transforms your website from a black box into a transparent system where you can see, measure, and optimize every visitor interaction. Whether you're optimizing conversion rates, improving user experience, or growing your business, web analytics is the foundation of data-driven decisions.
Start measuring today and unlock insights that drive growth.